Overview
Although the domestic silkworm (Bombyx mori) is an important model and economic animal, there is a lack of comprehensive database for this organism. Here, we developed the silkworm genome informatics database, SGID. It aims to bring together all silkworm related biological data and provide an interactive platform for gene inquiry and analysis. The function annotation in SGID is thorough and covers 98% of the silkworm genes. The annotation details include function description, gene ontology, KEGG, pathway, subcellular location, transmembrane topology, protein secondary/tertiary structure, homologous group and transcription factor. SGID provides genome scale visualization of population genetics test results based on high depth resequencing data of 158 silkworm samples. It also provides interactive analysis tools of transcriptomic and epigenomic data from 79 NCBI BioProjects. SGID is freely available at http://sgid.popgenetics.net. This database will be extremely useful to silkworm research in the future.
The biological data in SGID
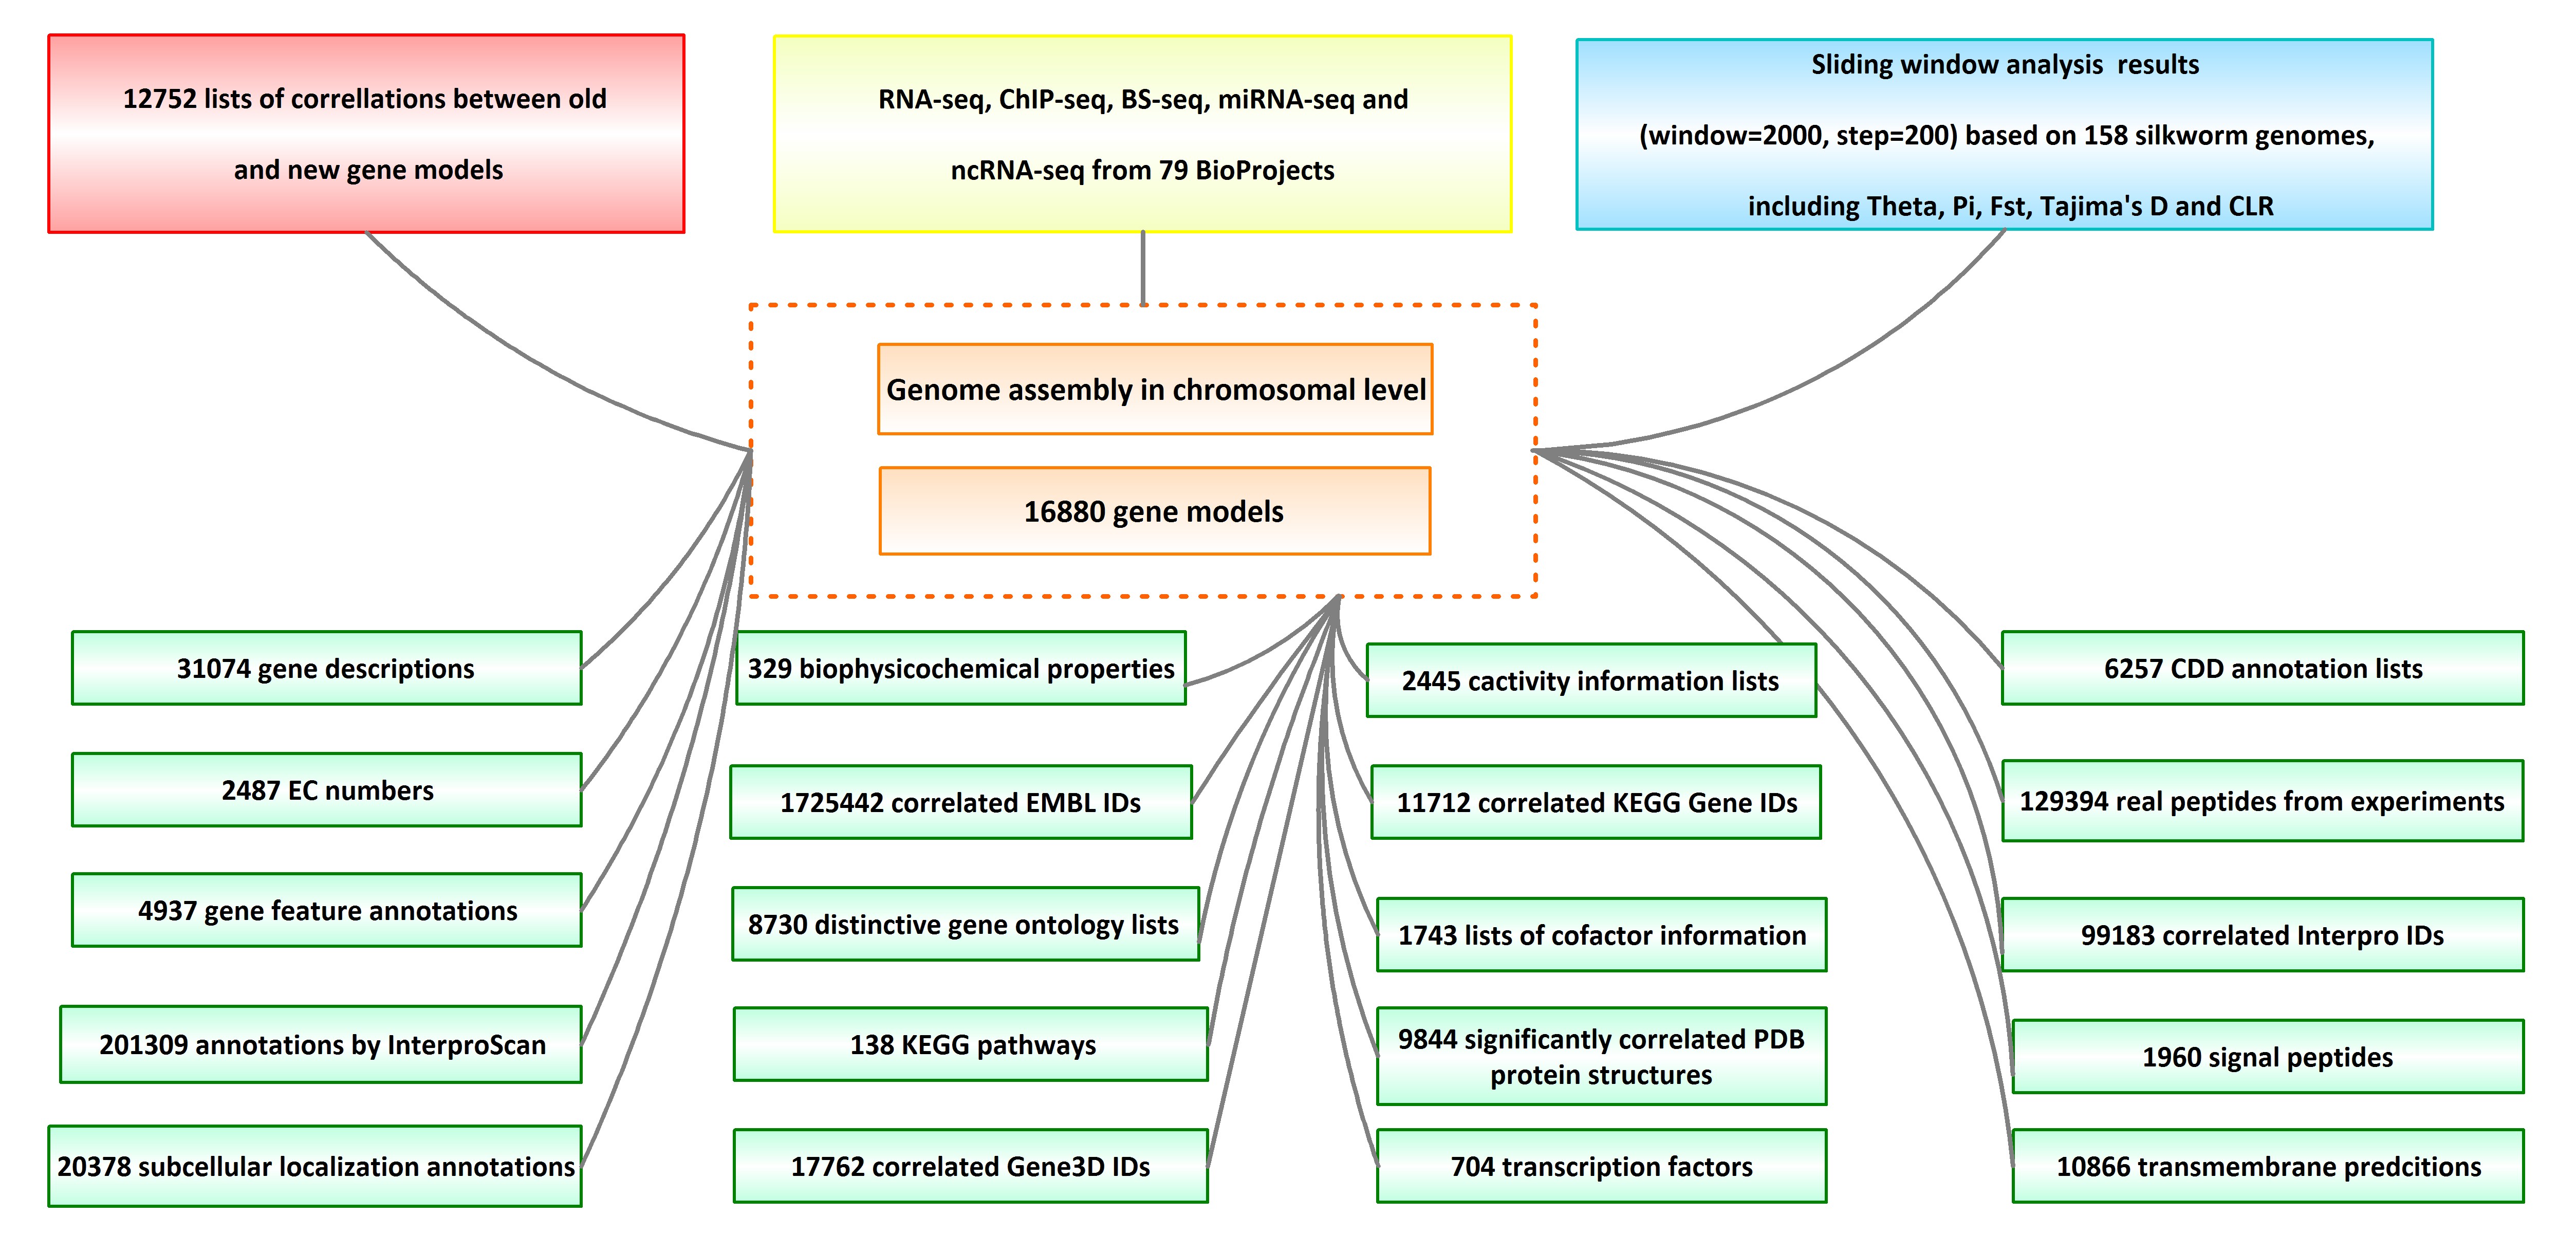
SilkBase annotated 16880 genes in the high quality assembly of the silkworm genome, but left 3329 without function descriptions. For these, SGID incorporated protein information from UniProt and re-annotated the functions of 15594 genes, within which 2962 got function annotations for the first time. For a lot of genes, SGID gives not only simple descriptions, but also information on function details, chemical properties, related publications, protein structure, topologies, pathways and gene ontologies. In addition to the available gene ontology (GO) annotations of 9147 genes in SilkBase, SGID newly labeled GO IDs for 5521 genes. Besides, SGID made KEGG annotations for 16028 genes and Entrez IDs for 16320 genes. These are important for research, especially for gene set function enrichment analysis.
Using peptide sequences from published experiments, we validated 2999 protein coding genes. They are of proteomics evidence. To depict one gene’s function in a cell, SGID provides information on gene’s subcellular localization and topology prediction. More than half (9592, 56.8%) of the silkworm genes are located in the nuclear, and 2878 genes (17.0%) have transmembrane regions. Furthermore, 1960 silkworm genes are predicted to have signal peptides. Encouragingly, 9844 silkworm proteins are of PDB matches with E-value <0.05, which infers that more than half (58.3%) silkworm expressed proteins have structural information. External links to UniProt Proteomes, PRIDE, Pfam, Interpro, SUPFAM, Gene 3D, Protein Modal Potal and PANTHER are also provided and they are helpful to understand the protein structure and related functions of one gene.
As a domesticated insect, the silkworm is important in evolution research. Totally, we identified 569 domestication gene candidates. Users can view and inspect theses domestication genes by a SGID tool named “Population Genetics”. Population genetics test results are also displayed in the genome bowser, where users can do sliding window analysis of interested genomic or genic segments. We also identified 81 genes possibly under balancing selection.
SGID includes transcriptomic data of 41 projects and epigenomic data of 38 projects. For transcriptomes, 28 are ‘DEG’, 9 are ‘Stage’ and 4 are ‘Tissue’ as we described in Materials and Methods. SGID includes 704 transcription factors (TF) belonging to 68 TF families. It also has 571401 repeat segments covering 27.5% of the silkworm genome, which is generally in accordance with previous records (Osanai-Futahashi et al., 2008). There are more retrotransposons (93%) than DNA transposons (7%). For retrotranposons, most are LINE (46%) and SINE (44%).
The genome browser in SGID
In SGID’s genome browser page, users can view the silkworm genes, repeat elements and population genetics test tracks subsequently. An input box and a list of buttons above the browser allow users to move, zoom in, zoom out, setting focus bar, generating figures or downloading the data of one track. A click onto a gene figure will take users to the gene detail page. Clicking on one point of some track will raise a dialog displaying the value at the point. Except for a genome browser, SGID also provides a browser to view epigenomic data. In the browser, users could view gene regulation signals at some specific genome position.
Retrieve genes’ information from SGID
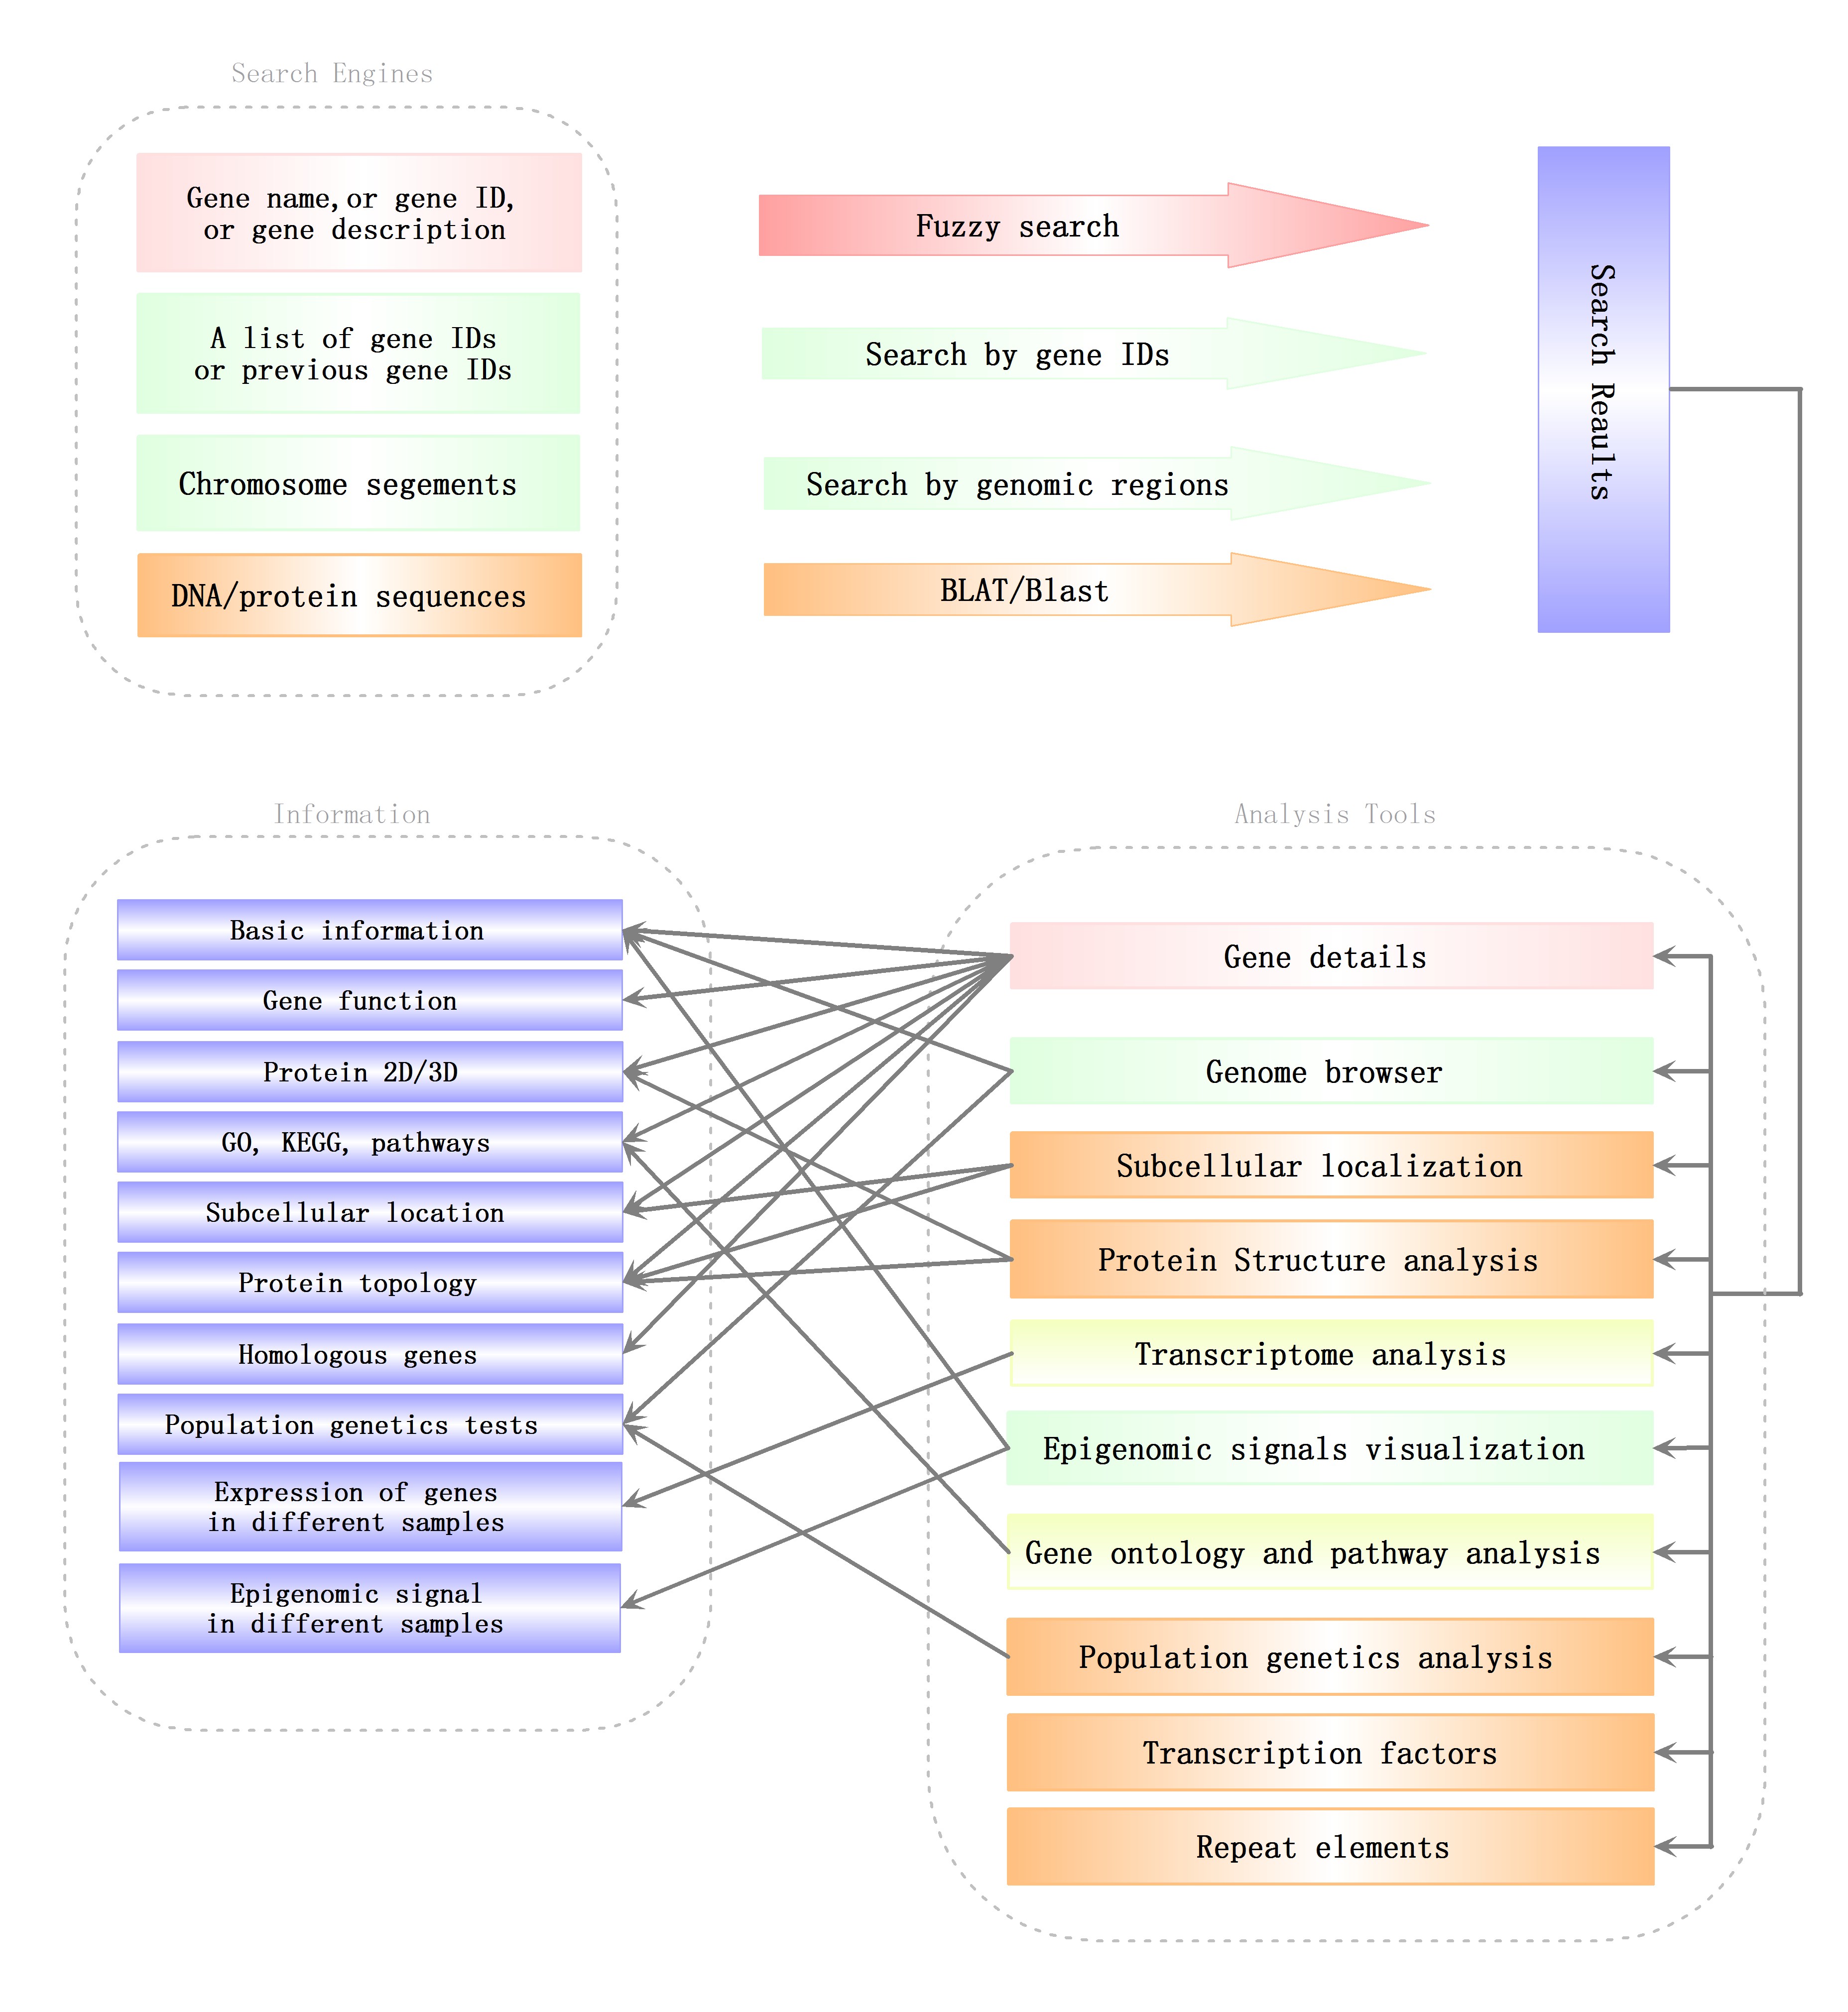
As a one-click type platform, SGID offers to search genes by a gene ID, a gene name, a gene function or even a brief description. In the page displaying search results, there are a list of gene information buttons within each result list. With the buttons, users can jump to to view gene details, a gene in genome browser, gene ontology and pathway, gene expression, regulation elements, gene structure and population genetics analysis results. In the detail page of each gene, aside from basic annotations (such as gene name, description, subcellular location and sequences), six information groups are listed subsequently, including “Summary”, “Ontologies”, “Topology”, “Population Genetics”, “Multiple Alignment” and “Gene Tree”. “Summary” mainly includes information resulted from protein sequence analysis. “Ontologies” displays a gene’s annotation on GO, KEGG Function, KEGG Pathway, and PANTHER. In the part of “Topology”, transmembrane regions are listed and marked in a diagram. If one gene’s protein product is of signal peptide, the region of the signal peptide will also be listed and marked. “Population Genetics” listed 5 population genetic test results (Pi, Theta, Tajima’s D, CLR and CSRT) and will give an interpretation about evolutionary forces. “Multiple Alignment” and “Gene Tree” displayed the multiple alignment of homologous genes at protein level and the phylogenetic tree produced based on the alignment.
To facilitate users to analyze a list of genes, SGID also offers to generate a list of gene information buttons through inputting a list of gene IDs. With the buttons, users can jump to some information view page directly like they do in search result page as referred above. Analogously, users can input a list of chromosome positions and obtain a list of genomic infomration links, with which users can view the genome browser or the epigenomics browser swiftly.
SGID analysis tools
To help users to visit data more quickly, we developed a list of analysis tools in SGID. As shown in the home page, “Gene Ontology” is a tool to retrieve GO, KEGG or Entrez numbers using a list of gene IDs. “Transcriptome” is a tool to view the expression of several genes in different experiment conditions, tissue or development stages. The results will be displayed in a heatmap figure. Stopping the mouse cursor at one cell of the heatmap will display the FKPM value of one gene at an experiment condition. The project’s name is listed at the top right and users can click it to view the project’s description. “Protein Structure”, “TF”, “Population Genetics”, “Repeat Elements” and “Subcellular localization” are interactive search tools, with which users can obtain a group of genes or items with some similar biological properties. “Cluster” listed the 1064 gene clusters we identified.